
Every figure on this page is from a named public source or first-party Search Console data, retrieved July 2026. This report is refreshed annually.
Florida’s construction clock is cooling — and that is remodeling news
Florida issued 76,941 new private housing permits in the first half of 2026, down 18.5% from 94,453 in the first half of 2025 (U.S. Census Bureau via FRED, series FLBPPRIV). June alone came in at 13,629 against 19,538 a year earlier — a 30% drop — and November 2025 was the softest month in the recent series at 9,652. Florida still out-builds almost everyone: June’s total is more than double Georgia’s and six times Michigan’s. But the direction matters for remodelers, because a cooling new-build market historically pushes contractor capacity and homeowner budgets toward renovating the homes people already own.
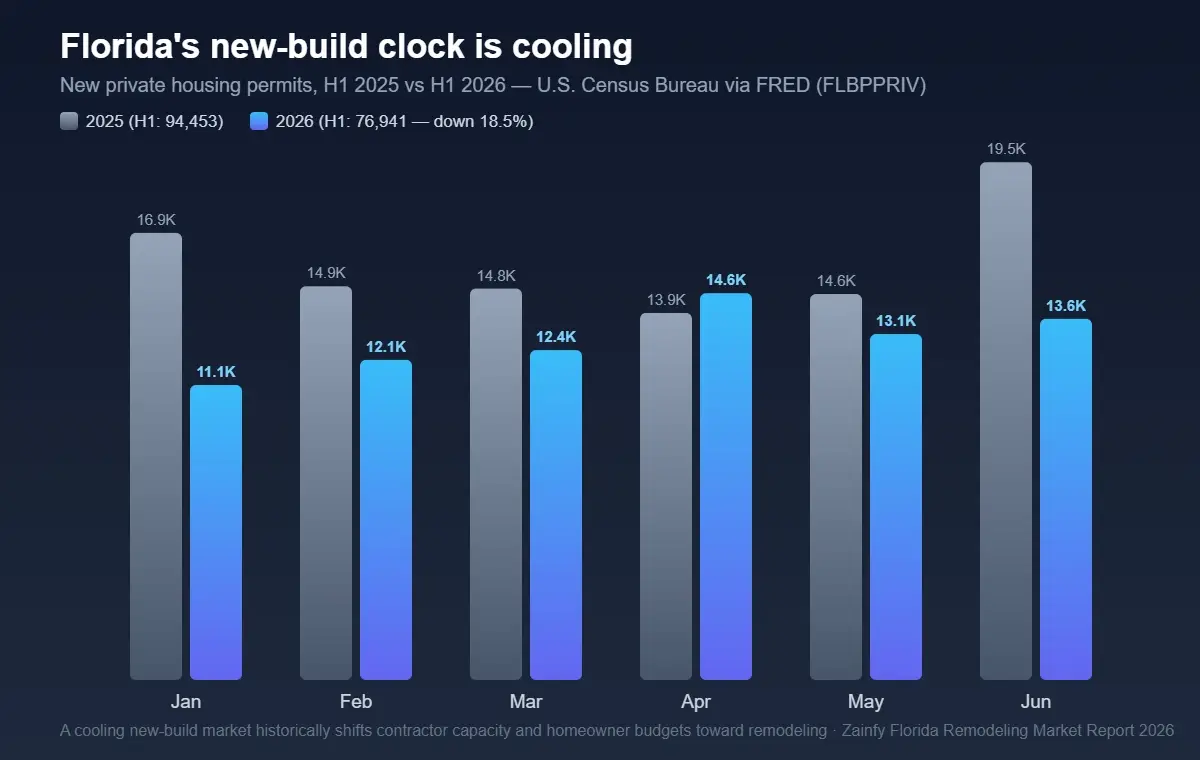
Two seasons, neither of them quiet
Florida remodeling demand runs on a double clock no other state has. From October through April, the snowbird influx concentrates homeowner attention — and remodel planning — in the coastal metros; contractors who are visible before that window opens catch the projects planned during it. Then from June 1 to November 30, the NOAA Atlantic hurricane season pivots demand toward hardening, repair and rebuild work. There is no off-season — only two different kinds of demand, and they reward different visibility. Georgia’s remodeling year runs on a different clock again — military PCS rotations around Fort Moore and Robins AFB move families in and out on a May-to-August cycle, renovating on the way in and prepping to sell on the way out.
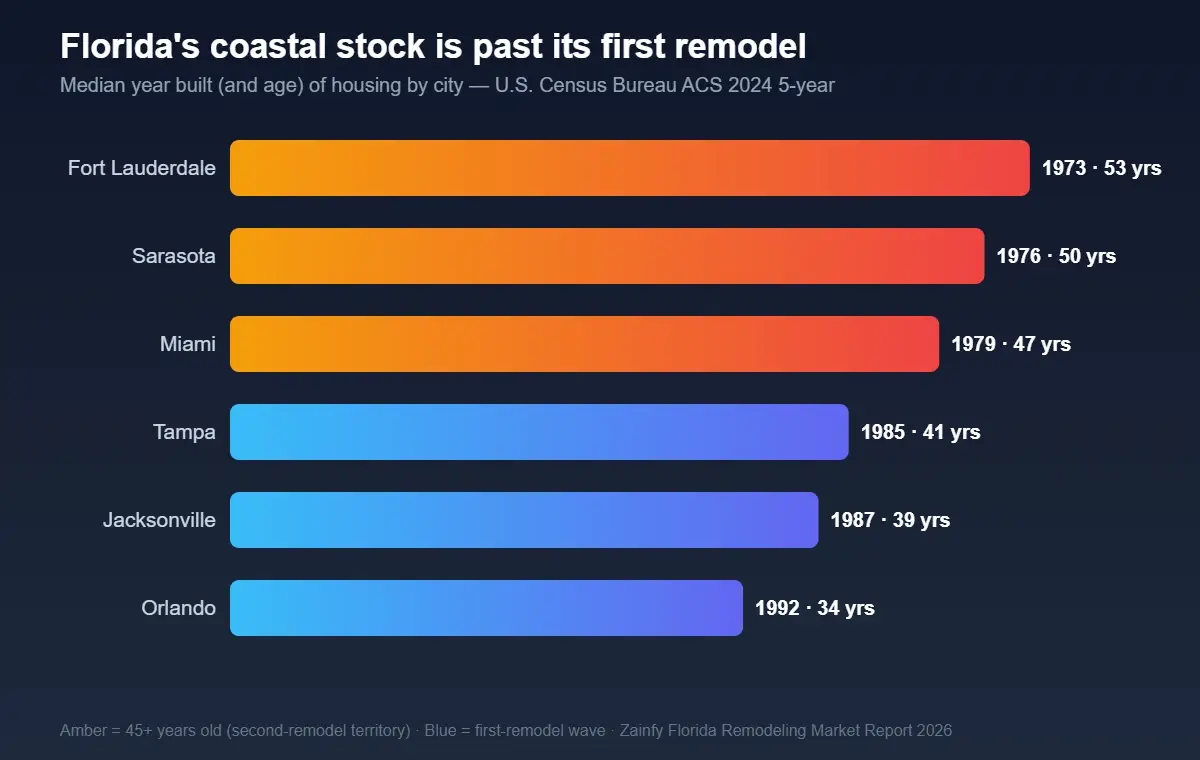
The coastal housing stock is past its first remodel
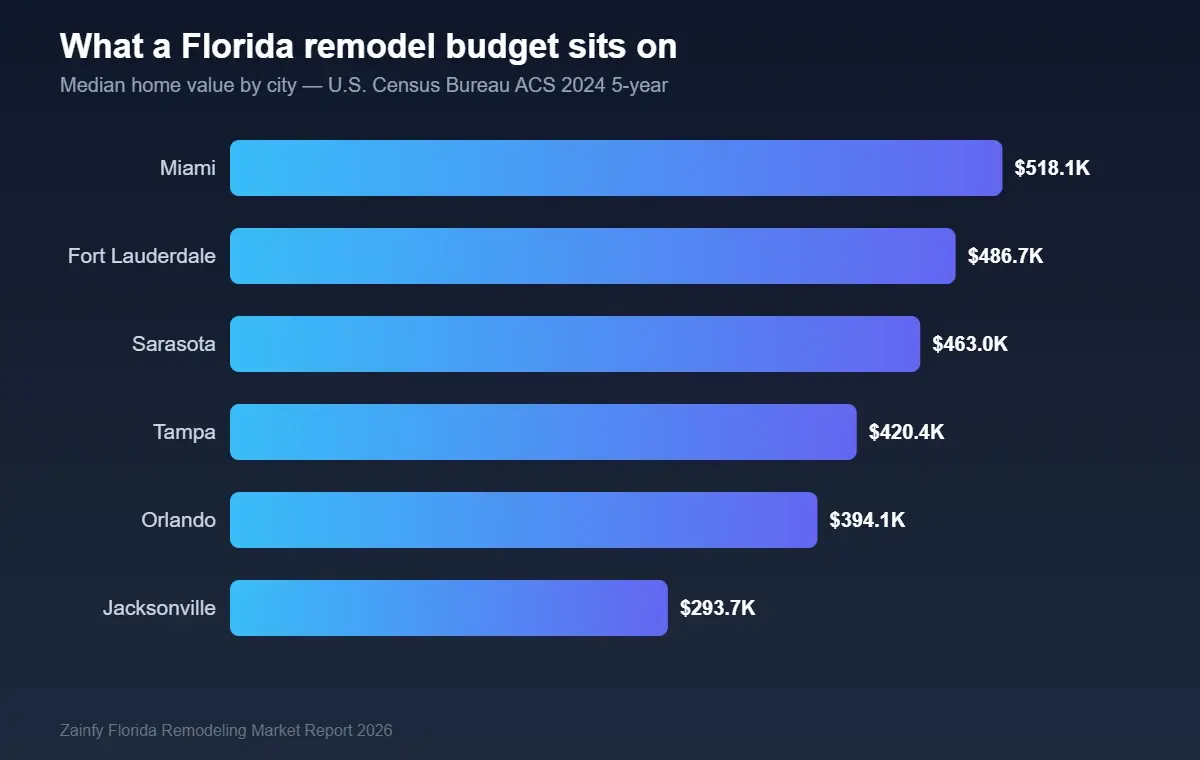
The single most underrated number in Florida remodeling is the age of the housing stock (U.S. Census Bureau ACS 2024 5-year):
| City | Median year built | Median home value | Median household income |
|---|---|---|---|
| Fort Lauderdale | 1973 | $486,700 | $83,130 |
| Sarasota | 1976 | $463,000 | $72,105 |
| Miami | 1979 | $518,100 | $62,462 |
| Tampa | 1985 | $420,400 | $75,475 |
| Jacksonville | 1987 | $293,700 | $69,872 |
| Orlando | 1992 | $394,100 | $72,336 |
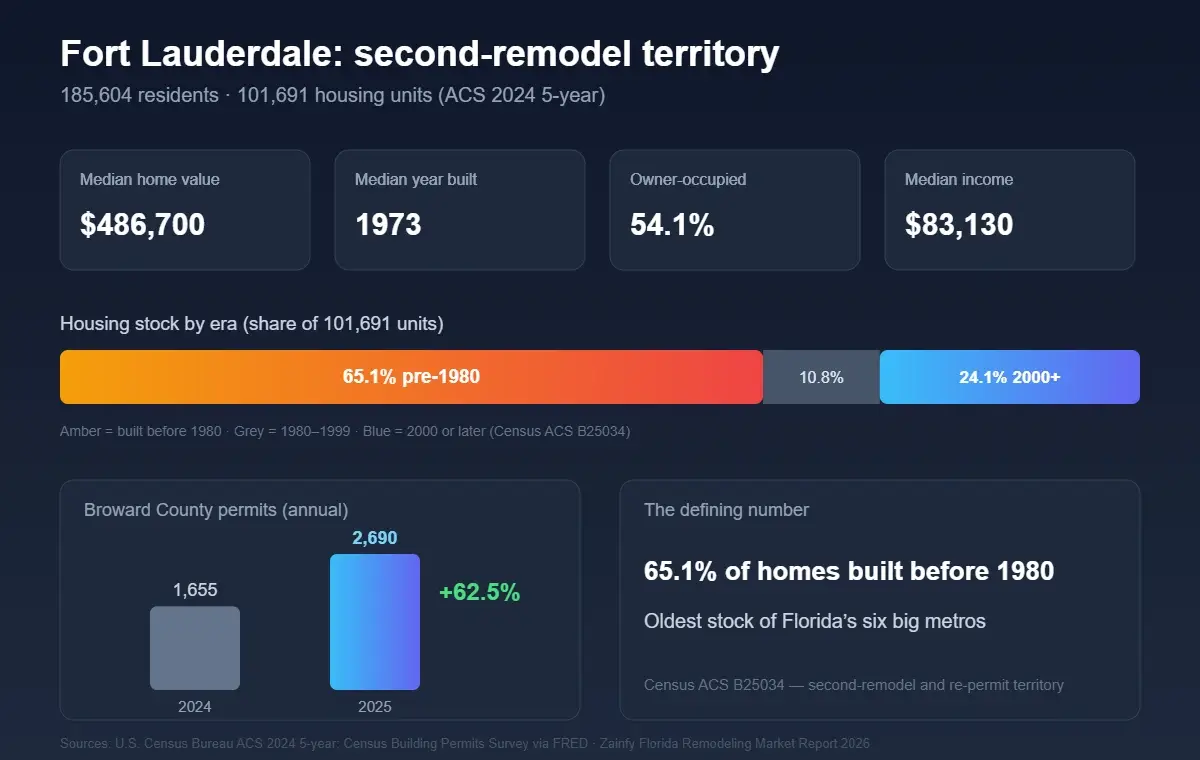
Fort Lauderdale: second-remodel territory
Fort Lauderdale is the smallest of the big coastal metros by population — 185,604 residents across 101,691 housing units — but it carries the highest median household income of the six markets in this report ($83,130) against a $486,700 median home value, with 54.1% of homes owner-occupied (ACS 2024 5-year). High income plus high-value stock is the profile of a market that buys quality and verifies contractors before calling.
The defining number is stock age: 65.1% of Fort Lauderdale’s housing was built before 1980 — the oldest housing base of any large Florida metro — and the median home dates to 1973. A 50-year-old coastal home is not on its first remodel; it is on its second or third, which means re-permitting, code-compliance upgrades, impact windows and structural work sit inside otherwise ordinary kitchen and bath projects.
New construction is growing from a small base — Broward County permits rose from 1,655 in 2024 to 2,690 in 2025 (Census Building Permits Survey via FRED) — but against 100,000+ existing units, renovation dwarfs new-build as the working market here. Add coastal permit complexity and the county’s exposure during the June–November hurricane season, and the remodel pipeline runs deep and year-round.
That stock profile shapes how homeowners search: credential-aware queries — licensed, permit-experienced, storm-hardening — rather than bargain hunting, concentrated into decisions made during the October–April snowbird window. A contractor page that answers those specific concerns is competing for buyers with the state’s highest household incomes. The search lane is unusually soft for a market this affluent: “bathroom remodel fort lauderdale” draws 250 searches a month at an $8.00 CPC with a keyword difficulty of just 5, and “kitchen remodel fort lauderdale” adds 150 more at KD 4 (Ahrefs, US, July 2026) — among the softest city terms in this report, in the metro with its highest incomes.
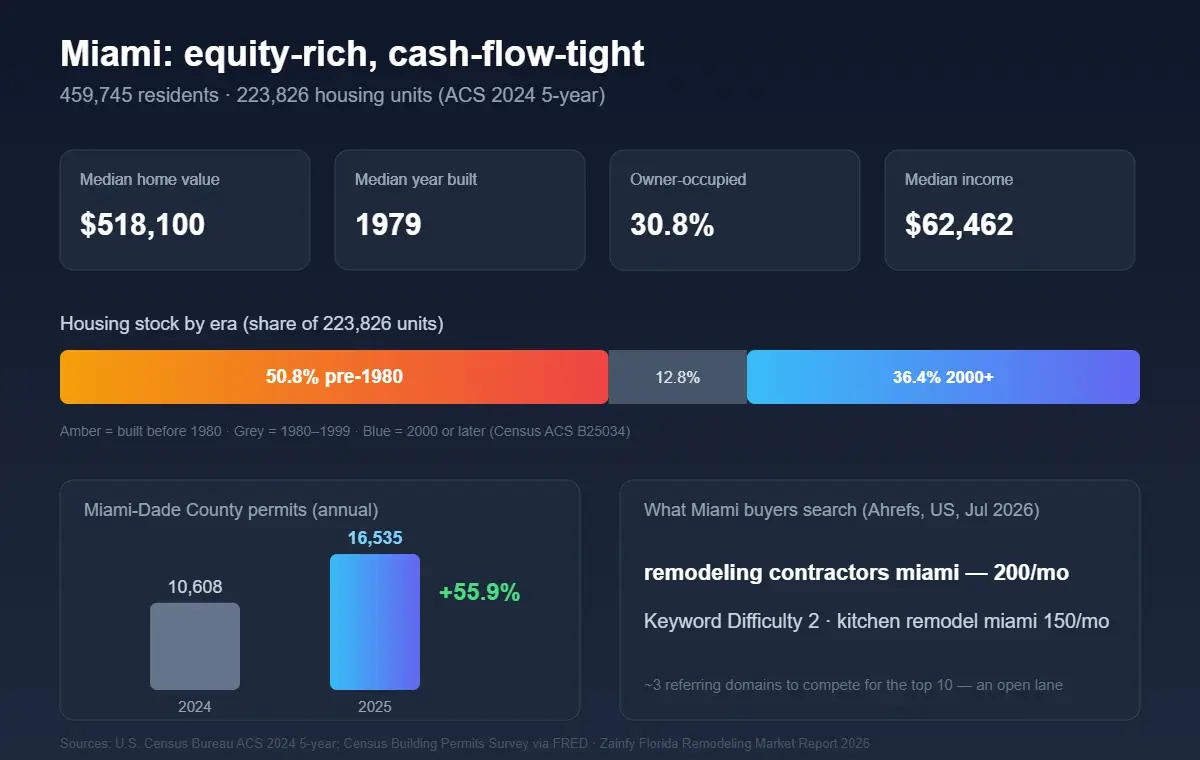
Miami: equity-rich, cash-flow-tight
Miami holds the largest housing stock of the six metros — 223,826 units serving 459,745 residents — and pairs the highest median home value on this list ($518,100) with the lowest median household income ($62,462; ACS 2024 5-year). That gap defines the buyer: owners sitting on serious equity while watching monthly cash flow, which makes financing options, phased scopes and transparent pricing the deciding factors in who gets hired.
The second defining number is tenure: only 30.8% of Miami homes are owner-occupied. More than two-thirds of the stock is held by landlords, investors and condo structures — so renovation demand splits between owner projects and a large rental-turn and investor-renovation market that hires on speed and reliability rather than design consultation. A contractor visible to both audiences is fishing in two ponds.
Half the stock (50.8%) predates 1980, yet Miami-Dade is simultaneously building again: county permits jumped from 10,608 in 2024 to 16,535 in 2025 (+55.9%; Census BPS via FRED). Aging stock plus a new-build surge means remodelers here compete against the option of moving — the winning renovation pitch in established neighborhoods is that location can’t be rebuilt.
The search lane is remarkably open for a metro this size: “remodeling contractors miami” (200 searches/month) carries a keyword difficulty of just 2 — roughly 3 referring domains to compete for the top 10 — and “kitchen remodel miami” (150/month) sits at KD 10 (Ahrefs, US, July 2026). The provider-choosing searches in Florida’s biggest market are still nearly uncontested.
Tampa: the proof market
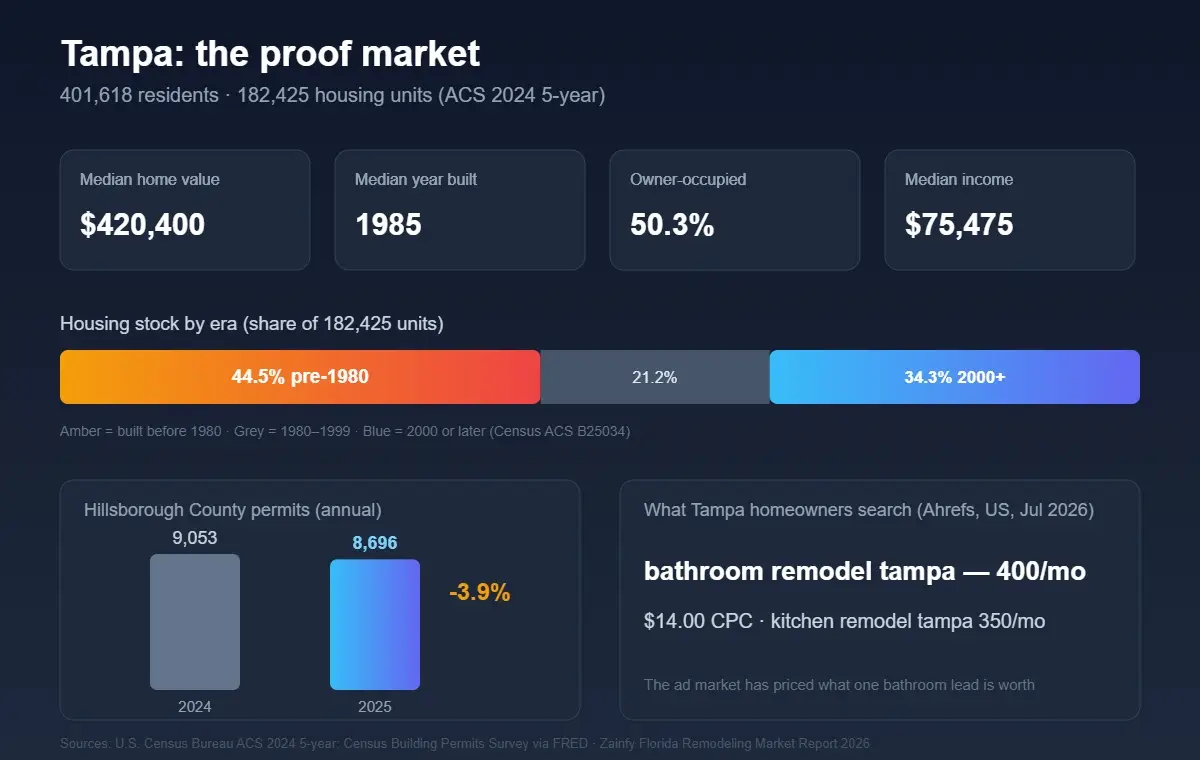
Tampa’s 401,618 residents live across 182,425 housing units with a $420,400 median value and $75,475 median household income (ACS 2024 5-year). Tenure is split almost evenly — 50.3% owner-occupied — which gives contractors two parallel demand streams: owner-led kitchen and bath remodels on one side, rental-turn and investor work on the other.
The stock is squarely in first-full-remodel years: median build year 1985, with 44.5% of units built before 1980 and about a third (34.3%) built since 2000. Homes from the late-70s-to-80s wave are aging out together — kitchens, baths and roofs hitting replacement age in the same neighborhoods at the same time.
Hillsborough County permits eased from 9,053 in 2024 to 8,696 in 2025 (−3.9%; Census BPS via FRED) — a flat-to-cooling build market sitting on an aging base, which is the classic setup for remodel work to take a growing share of contractor capacity. Bay-front exposure adds hurricane-hardening demand in the back half of every year.
The money searches confirm it: “bathroom remodel tampa” draws 400 searches a month and costs $14.00 per click to rent in ads — the market has literally priced what one bathroom lead is worth — while “kitchen remodel tampa” adds 350 more (Ahrefs, US, July 2026). Tampa is also the market behind the verified case study later on this page: the organic route to those same searchers is documented, position 74 to 21 in four months.
Orlando: the first-remodel wave is arriving now
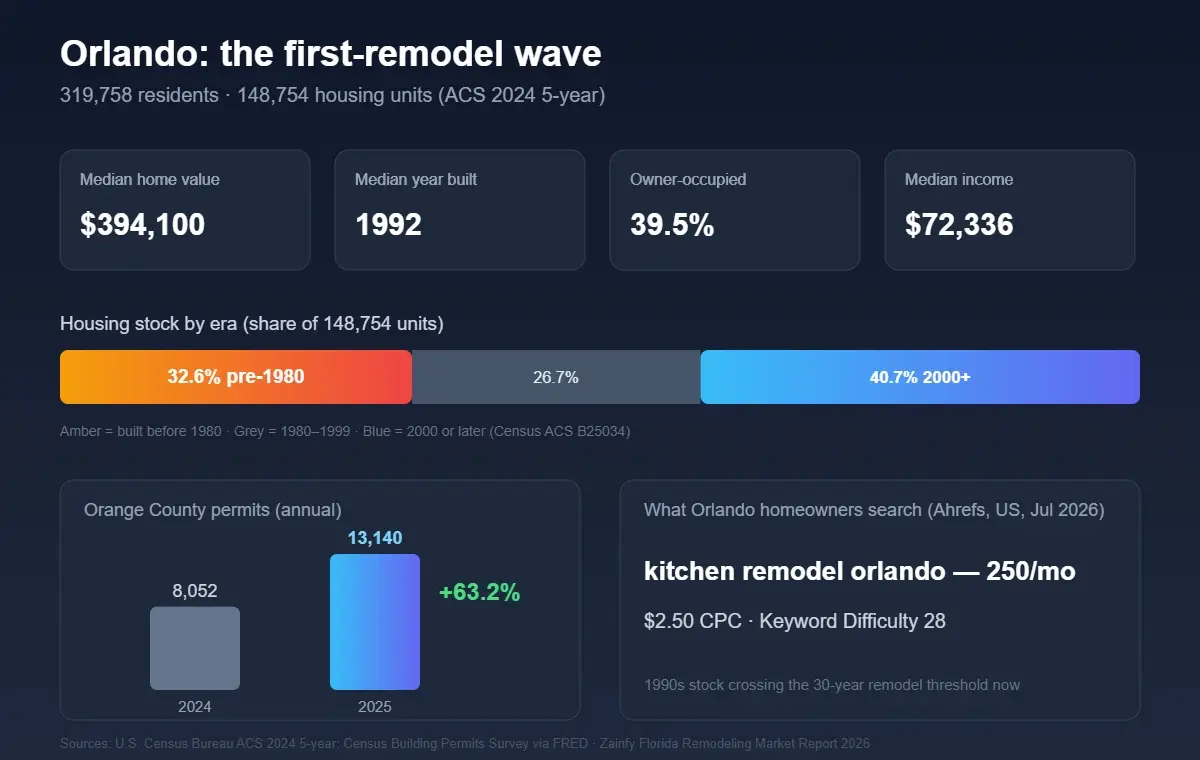
Orlando is the youngest market in this report: 319,758 residents across 148,754 units, median home value $394,100, median household income $72,336, and an owner-occupancy rate of 39.5% (ACS 2024 5-year) — a renter-heavy urban core ringed by owner-occupied suburbs where the remodel checks get written.
The stock skews new: median build year 1992, with 40.7% of all units built since 2000 and only 32.6% before 1980 — the lowest pre-1980 share of the six metros. That is not a weakness; it is a timing signal. The huge 1990s–2000s wave is crossing the 25-to-35-year threshold right now, where original kitchens, baths and roofs stop being acceptable — Orlando’s first big remodel wave is arriving on schedule.
Meanwhile Orange County is the fastest-growing build market of the six: permits surged from 8,052 in 2024 to 13,140 in 2025 (+63.2%; Census BPS via FRED). More building means more contractors competing for attention — and a still-bigger remodel pipeline forming behind it as each new subdivision starts its own 25-year clock.
“Kitchen remodel orlando” draws 250 searches a month at a $2.50 CPC and keyword difficulty 28 (Ahrefs, US, July 2026) — a winnable middle lane: harder than Miami’s wide-open SERP, far softer than Jacksonville’s, and pointed at exactly the 1990s kitchens now coming due.
Jacksonville: the volume market
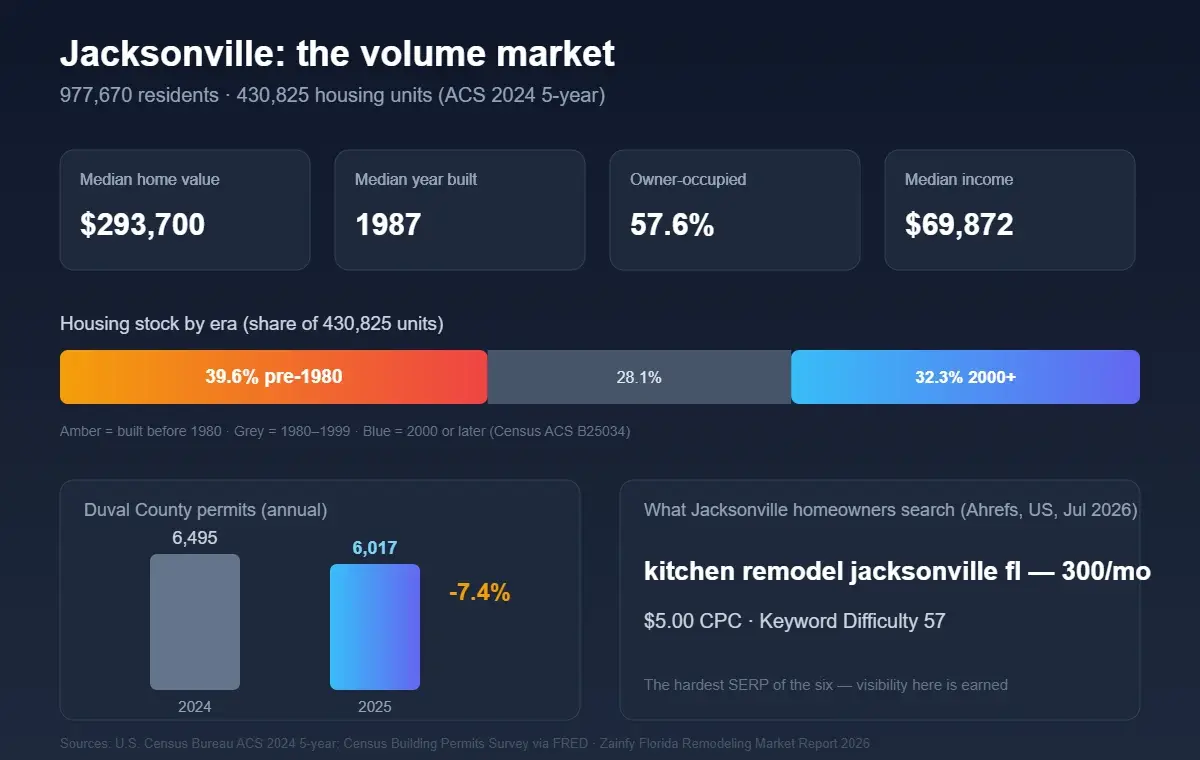
Jacksonville is the population giant of Florida remodeling: 977,670 residents — more than double any other city in this report — across 430,825 housing units spanning the largest city land area in the contiguous US (ACS 2024 5-year). The $293,700 median value is the entry point among the big metros, but the sheer scale of the owner base changes the math.
That base is the most owner-held of the six: 57.6% owner-occupied, the classic profile of homeowners who research, compare and hire remodelers directly. Stock age spreads evenly across eras — 39.6% pre-1980, 28.1% from the 80s–90s, 32.3% since 2000, median build 1987 — so demand covers everything from first kitchens to full-gut renovations simultaneously.
Duval County permits slipped from 6,495 in 2024 to 6,017 in 2025 (−7.4%; Census BPS via FRED). A cooling build market laid over 430,000 aging, majority-owner-held units tilts contractor economics toward renovation — there is simply more standing stock per new rooftop here than anywhere else in the state’s big metros.
The search market has noticed: “kitchen remodel jacksonville fl” pulls 300 searches a month at a $5.00 CPC — but with keyword difficulty 57 (~113 referring domains to compete for the top 10), it is the hardest SERP of the six (Ahrefs, US, July 2026). The practical lane for a Jacksonville remodeler is the long tail: neighborhood, project-type and credential pages rather than a head-term shootout.
Sarasota: the post-Ian coast
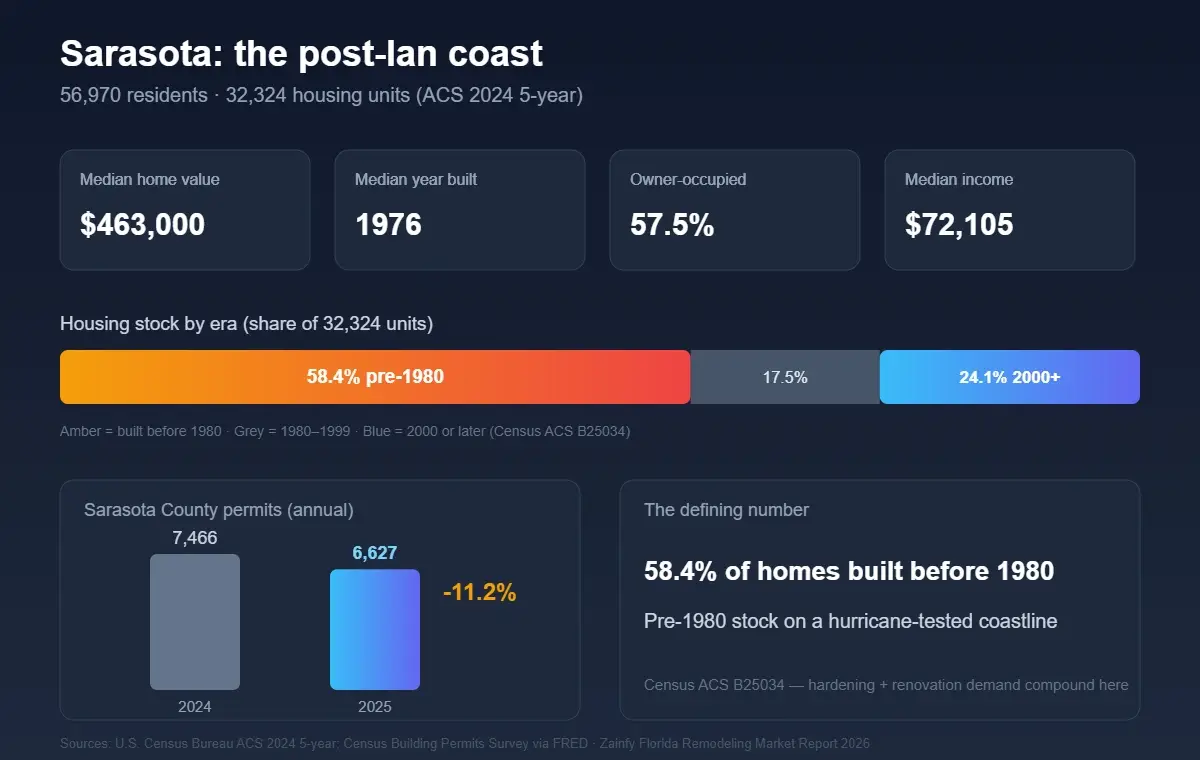
Sarasota is the boutique market of the six: just 56,970 residents and 32,324 housing units — but with a $463,000 median home value, $72,105 median income and 57.5% owner-occupancy (ACS 2024 5-year), it packs high-value, owner-held demand into a small footprint where reputation travels fast.
Its stock is coastal-old: 58.4% of units predate 1980, median build year 1976. Pre-1980 construction on a hurricane-tested shoreline means two demand streams compound — the normal renovation cycle of 50-year-old kitchens and baths, plus hardening work (roofs, openings, envelope) that post-Hurricane Ian Southwest Florida is still cycling through.
Sarasota County’s build side is cooling: permits fell from 7,466 in 2024 to 6,627 in 2025 (−11.2%; Census BPS via FRED), while the renovation side keeps its own clock — snowbird owners returning each October to homes another year older, on a coast where every storm season re-runs the hardening conversation.
Search behavior follows: storm-aware credentials — impact-rated openings, roof tie-downs, permit experience — function as search terms here, not marketing extras. For a Sarasota remodeler, the visibility play is proving that competence on pages before the October return and before the June season-start, the two moments the market makes decisions. The volumes hold up despite the footprint: “kitchen remodel sarasota” draws 200 searches a month at a $5.00 CPC — more than Miami’s kitchen term, in a city with roughly one-eighth the population — but at keyword difficulty 36 it is the second-hardest term in the keyword table below, behind only Jacksonville. The realistic entry point is “bathroom remodel sarasota” (150 searches a month, $8.00 CPC, KD 16) and the storm-hardening long tail (Ahrefs, US, July 2026).
What Florida contractors are searching for (first-party data)
From Zainfy’s Search Console footprint across Florida-market pages (July 2026, shares of geo-tagged demand): Florida carries roughly 29% of the three-state contractor-marketing demand we measure — about half of Georgia’s share and nearly double Michigan’s. Florida’s contractor searches also skew provider-specific (“seo company for remodelers” style long-tails) rather than generic marketing terms, which means the demand lands on specific pages, not homepages.
What Florida homeowners search for
These are bottom-of-funnel money terms — the people typing them are choosing a contractor, not browsing ideas. City-tagged volumes (Source: Ahrefs, US database, July 2026):
| Keyword | Searches/month (Ahrefs) | Keyword Difficulty | CPC |
|---|---|---|---|
| bathroom remodel tampa | 400 | 23 | $14.00 |
| kitchen remodel tampa | 350 | 33 | $0.25 |
| kitchen remodel jacksonville fl | 300 | 57 | $5.00 |
| kitchen remodel orlando | 250 | 28 | $2.50 |
| bathroom remodel fort lauderdale | 250 | 5 | $8.00 |
| remodeling contractors miami | 200 | 2 | $4.50 |
| kitchen remodel sarasota | 200 | 36 | $5.00 |
| kitchen remodel miami | 150 | 10 | $4.00 |
| kitchen remodel fort lauderdale | 150 | 4 | $6.00 |
| bathroom remodel sarasota | 150 | 16 | $8.00 |
Two numbers stand out. “Bathroom remodel tampa” costs $14.00 per click to rent in ads — the market has priced what that searcher is worth. And “remodeling contractors miami” carries a keyword difficulty of just 2, meaning roughly 3 referring domains are enough to compete for the top 10 — in the largest metro in the state, the provider-choosing search is still an open lane. City-tagged searches are where the hiring decision actually lands.
What happens when a Florida contractor closes the visibility gap
One verified Florida engagement, figures from the client’s own Search Console account, screenshots in the linked case study — NextGen Construction, a Tampa remodeler:
- Average position 74 → 21 in 4 months
- Organic clicks 56 → 1,730/month (+2,989%)
- Impressions 7.67K → 86.3K (+1,025%)
- 1,600+ ranking keywords; $5,500/month equivalent traffic value
The pattern matches what the stock-age data predicts: when a contractor’s pages answer the specific search a Florida homeowner types — city, project, credential — the demand documented above converts.
What this means for a Florida remodeler
Three moves follow from the data. First, treat the cooling permit curve as a demand signal: new-build slowdowns historically feed remodel pipelines, and the contractors visible when budgets shift capture them. Second, market to your stock age — Fort Lauderdale and Sarasota owners are on their second remodel and search accordingly, while Orlando’s first wave is just arriving. Third, work the double clock: visibility built before the snowbird window (October) and before hurricane season (June) is what converts each season’s demand, because rankings move in months, not weeks.
Michigan’s remodeling market runs on the opposite clock — one compressed spring season instead of two overlapping ones — and visibility built before each season is what converts either one.
About the data: Florida permits — U.S. Census Bureau via FRED (FLBPPRIV), retrieved July 2026. Year built, home values and household income — U.S. Census Bureau ACS 2024 5-year, via Census Reporter. Hurricane season dates — NOAA. Search demand shares — first-party Google Search Console data, Zainfy, July 2026. Client figures verified in the client-owned account; case study linked. This report pairs with our Remodeling Contractor Search Demand Report 2026, and with our test of ChatGPT, Gemini and Perplexity — what the assistants said about Florida contractors. This report is one of five in our published market research.
This page is refreshed annually. Next refresh: July 2027.
Zainfy — SEO, WordPress web design, social media marketing and paid ads management for home remodeling and construction contractors in Georgia, Florida and Michigan.