
Every figure on this page is from a named public source or first-party Search Console data, retrieved July 2026. This report is refreshed annually.
Michigan compresses its remodeling year into four months
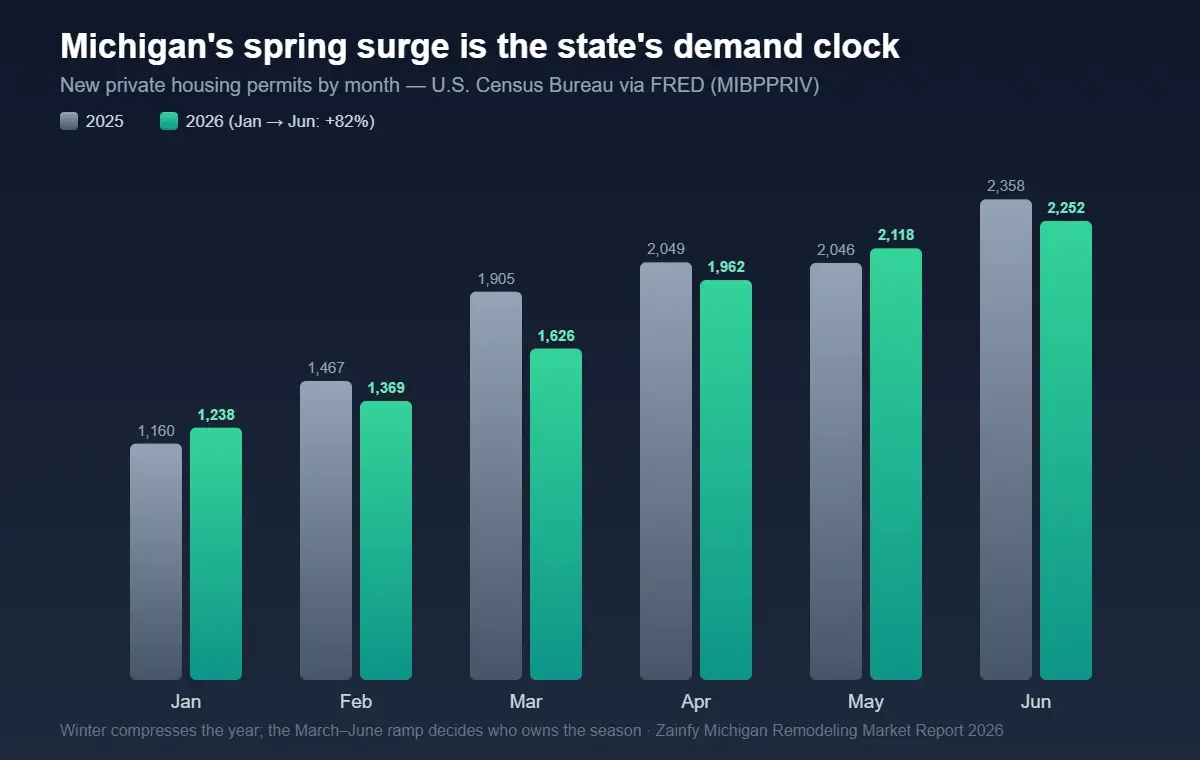
Michigan’s demand clock is the sharpest of the three states we measure. New private housing permits ran from 1,238 in January 2026 to 2,252 by June — an 82% ramp (U.S. Census Bureau via FRED, MIBPPRIV) — repeating 2025’s pattern, when the year bottomed in January at 1,160 and peaked in October at 2,555. Winter freezes the ground and the market; the March–June window is when Michigan homeowners commit to projects, and the contractors visible in February own the season.
The oldest housing stock in our three-state footprint
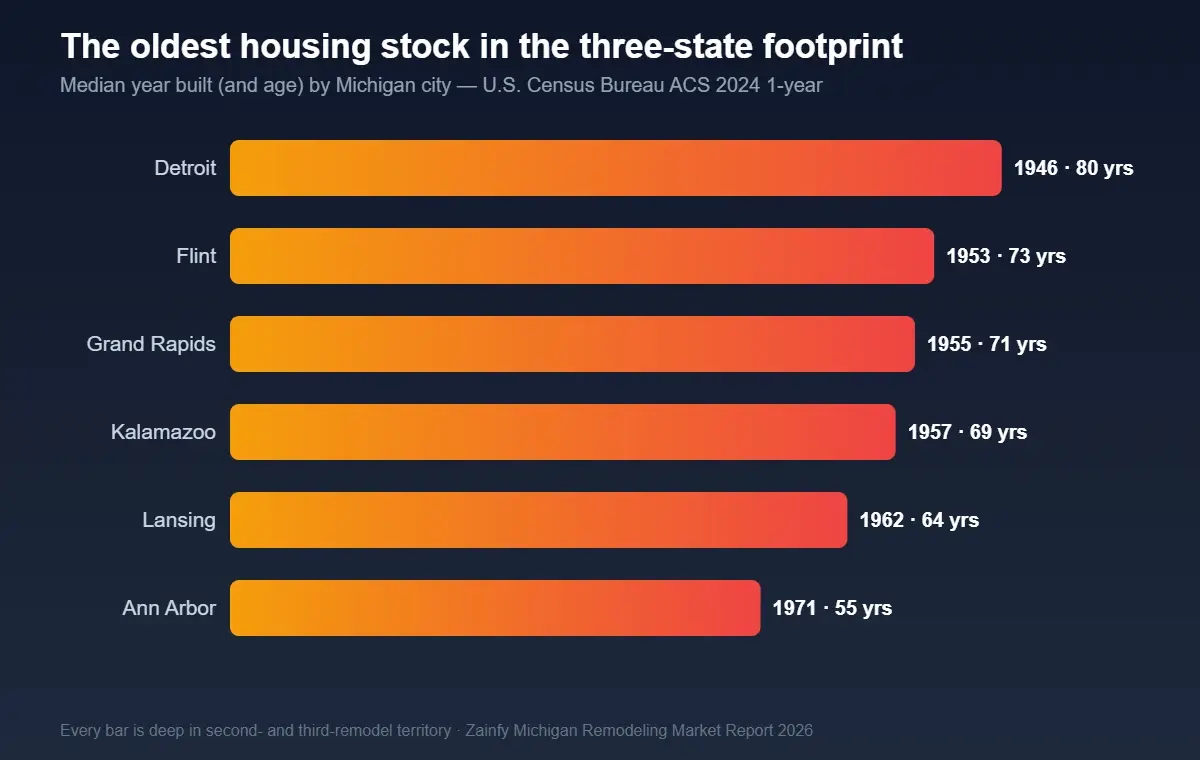
Michigan’s defining remodeling fact is age. In every major market, the median home predates 1972 — and in Detroit it predates World War II’s end (U.S. Census Bureau ACS 2024 1-year):
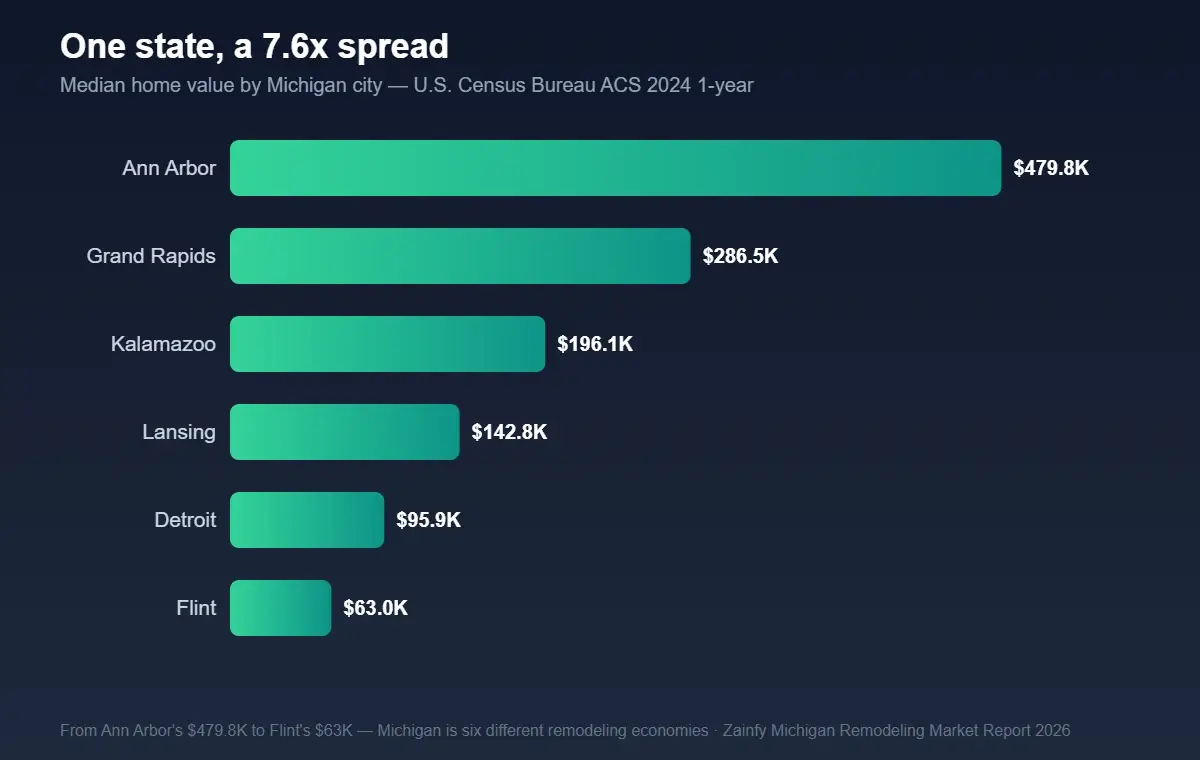
| City | Median year built | Median home value | Median household income | Owner-occupied |
|---|---|---|---|---|
| Detroit | 1946 | $95,900 | $39,209 | 51.0% |
| Flint | 1953 | $63,000 | $41,410 | 54.3% |
| Grand Rapids | 1955 | $286,500 | $70,515 | 53.5% |
| Kalamazoo | 1957 | $196,100 | $59,226 | 43.2% |
| Lansing | 1962 | $142,800 | $55,366 | 52.9% |
| Ann Arbor | 1971 | $479,800 | $80,603 | 45.6% |
Detroit: 343,000 units of pre-war stock
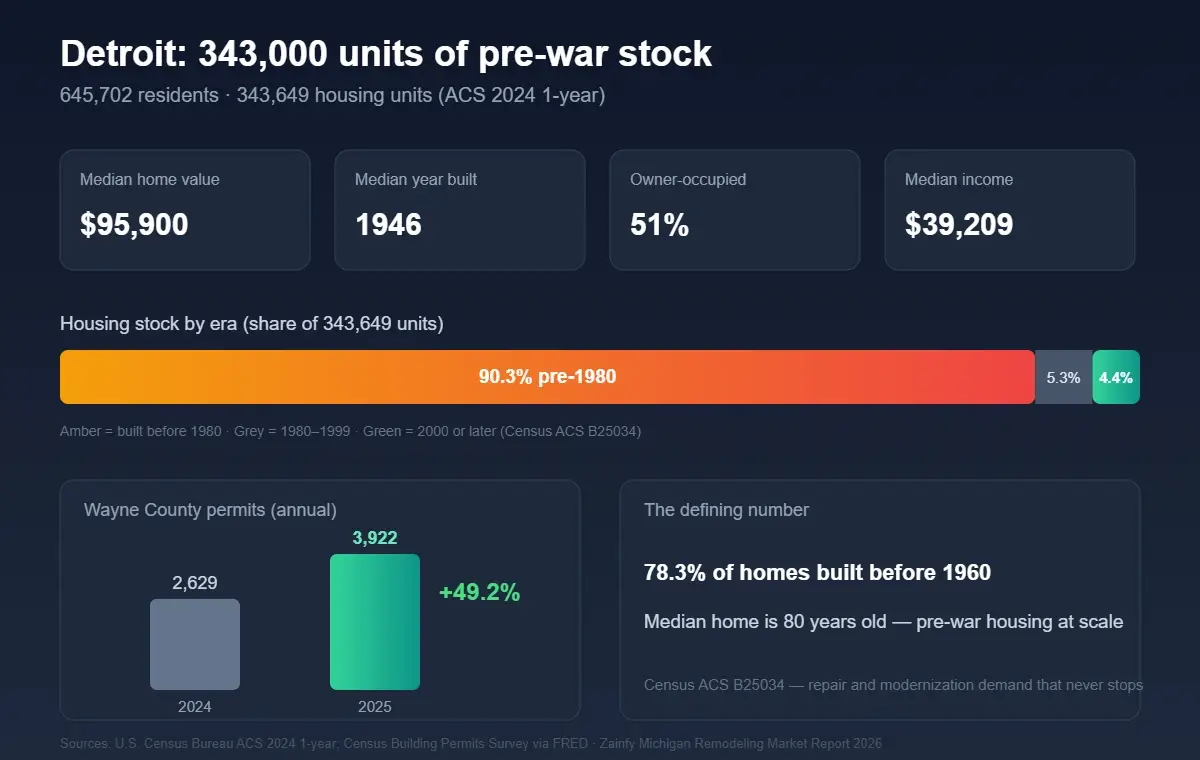
Detroit is the largest remodeling stock in Michigan by an order of magnitude: 343,649 housing units serving 645,702 residents (ACS 2024 1-year). The economics are unlike anywhere else in this report — a $95,900 median home value against $39,209 median household income, with 51.0% of homes owner-occupied. Individual project budgets are smaller, but the volume of necessary work is enormous.
The stock is historic in the literal sense: the median Detroit home was built in 1946, 78.3% of all units predate 1960, and only 4.4% were built this century. An 80-year-old median house generates demand that never switches off — roofs, plumbing, electrical, windows, insulation, kitchens and baths all cycling simultaneously across 343,000 units.
The build side is waking up: Wayne County permits jumped from 2,629 in 2024 to 3,922 in 2025 (+49.2%; Census BPS via FRED) — the post-industrial revival showing up in the data. New construction concentrated downtown and in select neighborhoods pulls trade capacity, which tightens availability for renovation work everywhere else and rewards remodelers who are easy to find.
For a Detroit remodeler the strategic read is scale plus specificity: the metro splits across Wayne, Oakland and Macomb counties with separate permit authorities, and homeowners search by neighborhood and suburb, not by “Detroit” alone. Visibility built suburb by suburb matches how this market actually hires.
Grand Rapids: the west-side anchor
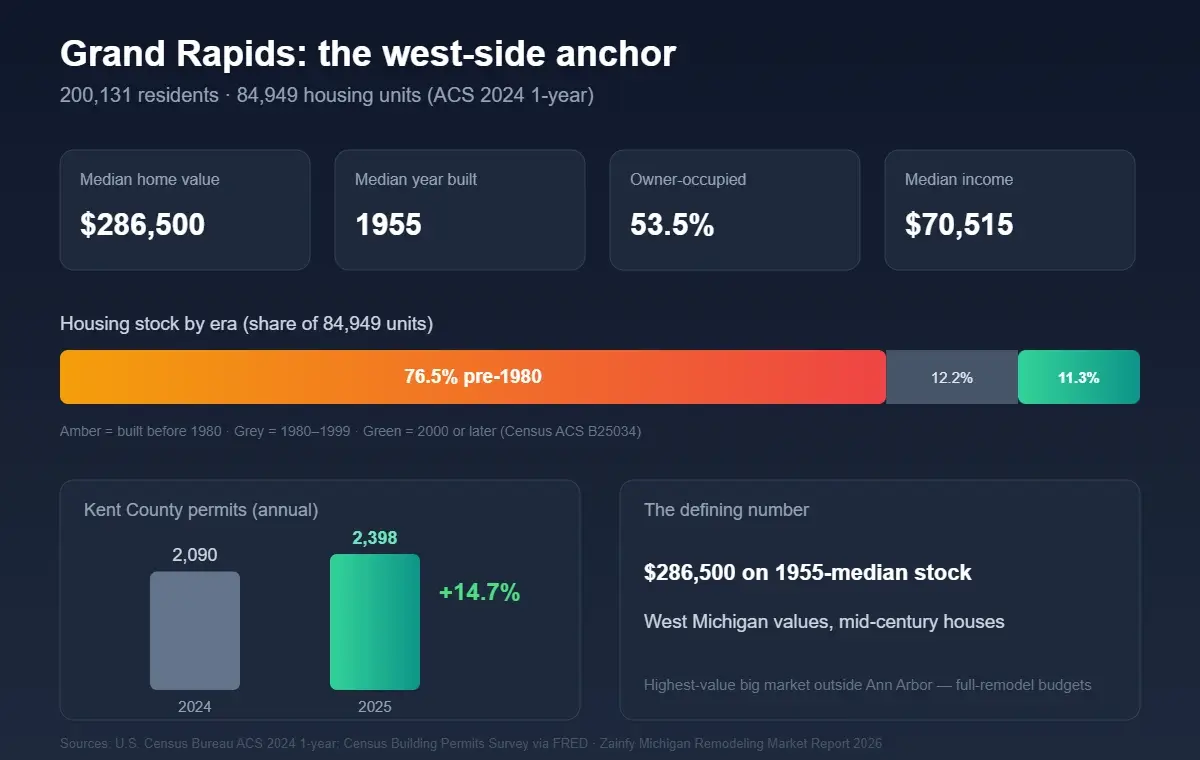
Grand Rapids is West Michigan’s economic anchor: 200,131 residents across 84,949 units, a $286,500 median home value — the highest of Michigan’s big markets outside Ann Arbor — and $70,515 median household income, with 53.5% owner-occupancy (ACS 2024 1-year). This is where Michigan’s full-remodel budgets live at volume.
The stock runs old: median build year 1955, with 76.5% of units predating 1980 and 57.6% predating 1960. Mid-century houses carrying west-side property values is the classic setup for serious kitchen, bath and whole-home renovation — owners with equity in houses worth updating.
Kent County’s build side is growing steadily rather than explosively: permits rose from 2,090 in 2024 to 2,398 in 2025 (+14.7%; Census BPS via FRED). Steady new-build alongside aging stock keeps both trade demand and remodel demand strong — and keeps competition for visibility rising.
The spring surge hits hardest here: West Michigan’s lake-effect winters make the March–June window the whole ballgame. A Grand Rapids remodeler whose pages, profile and reviews are in place by February is positioned for the season; one who starts marketing in April is renovating other contractors’ leftovers.
Ann Arbor: the university premium
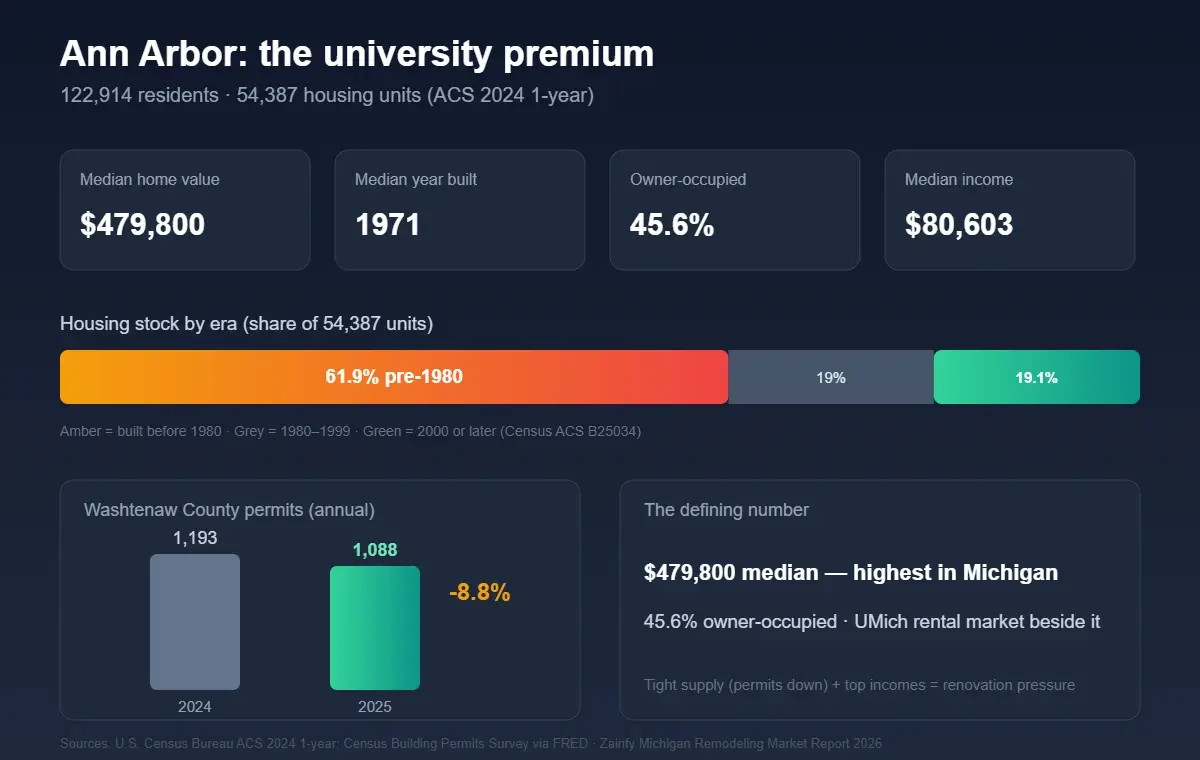
Ann Arbor is Michigan’s premium market: a $479,800 median home value — 5x Detroit’s — with the state’s top median household income ($80,603) across 54,387 units and 122,914 residents (ACS 2024 1-year). It is also a split market: only 45.6% of homes are owner-occupied, because the University of Michigan sustains one of the largest rental sectors in the state.
That split creates two demand streams on one housing base. Owner-occupied Ann Arbor — median build 1971, the newest stock of the six but still 55 years old — generates high-budget, design-led renovation. The rental side generates lease-turnover updates timed to the academic calendar, hired on speed and reliability.
Supply is the tightest of the six markets: Washtenaw County permits actually fell from 1,193 in 2024 to 1,088 in 2025 (−8.8%; Census BPS via FRED). When almost nothing new is built in a high-income market, demand has one outlet: improving what exists. Constrained supply is renovation pressure by another name.
For a remodeler, Ann Arbor rewards credential-forward positioning — this is a market of researchers who compare portfolios, reviews and process before making contact, and the university calendar gives the rental-work stream a predictable annual rhythm.
Lansing: the capital market
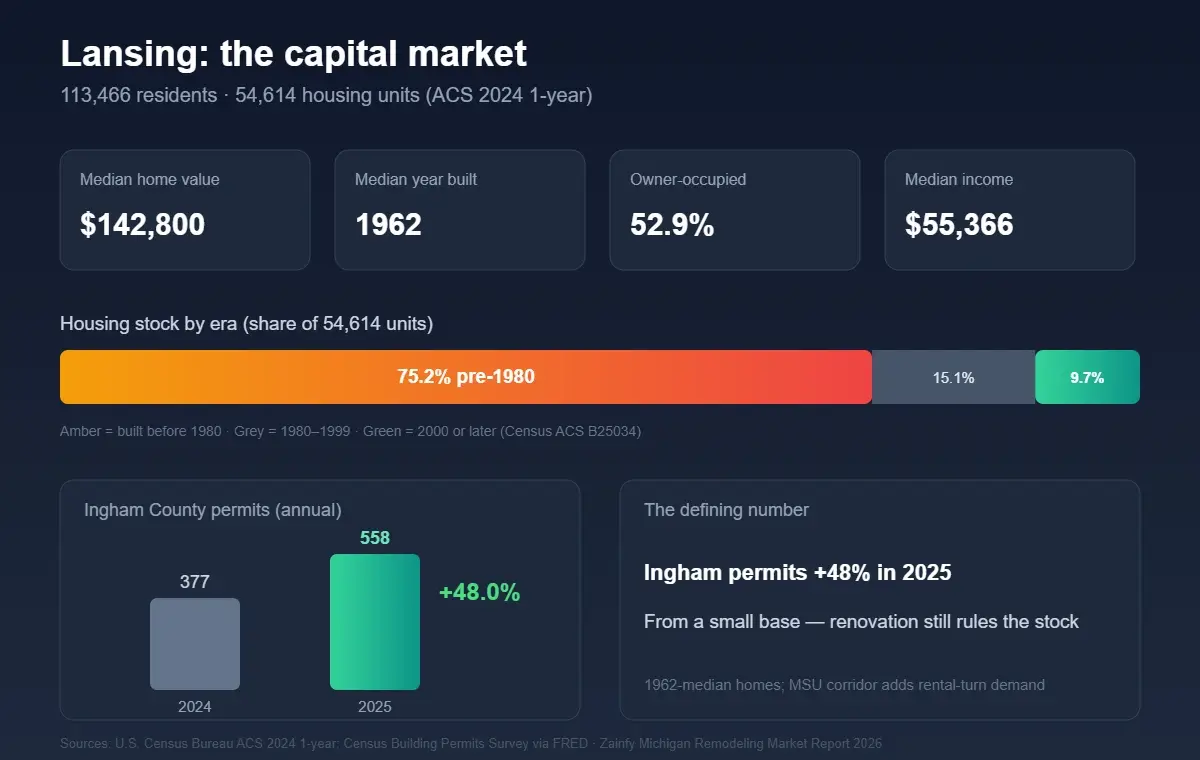
Lansing pairs government-anchored employment stability with some of the most accessible housing in the state: 113,466 residents across 54,614 units, a $142,800 median home value on $55,366 median income, and 52.9% owner-occupancy (ACS 2024 1-year). Stable paychecks on affordable houses is a steady-remodel profile — projects driven by need and plans, not speculation.
The stock is squarely mid-century: median build 1962, three-quarters (75.2%) built before 1980. Sixty-year-old housing generates the full renovation menu — kitchens and baths overdue for their second update, plus the systems work (electrical, plumbing, windows) that mid-century homes now require.
Ingham County’s build side posted the second-fastest growth of the six markets: permits rose from 377 in 2024 to 558 in 2025 (+48.0%; Census BPS via FRED) — though from the smallest base, which means new construction remains a sliver next to the standing stock. The remodel market is the market here.
East Lansing’s MSU corridor adds the university dynamic in miniature: lease-cycle renovation demand beside owner-occupied neighborhoods. A Lansing remodeler who speaks to both — and is visible before the March thaw — covers the whole demand map.
Flint: the proof market
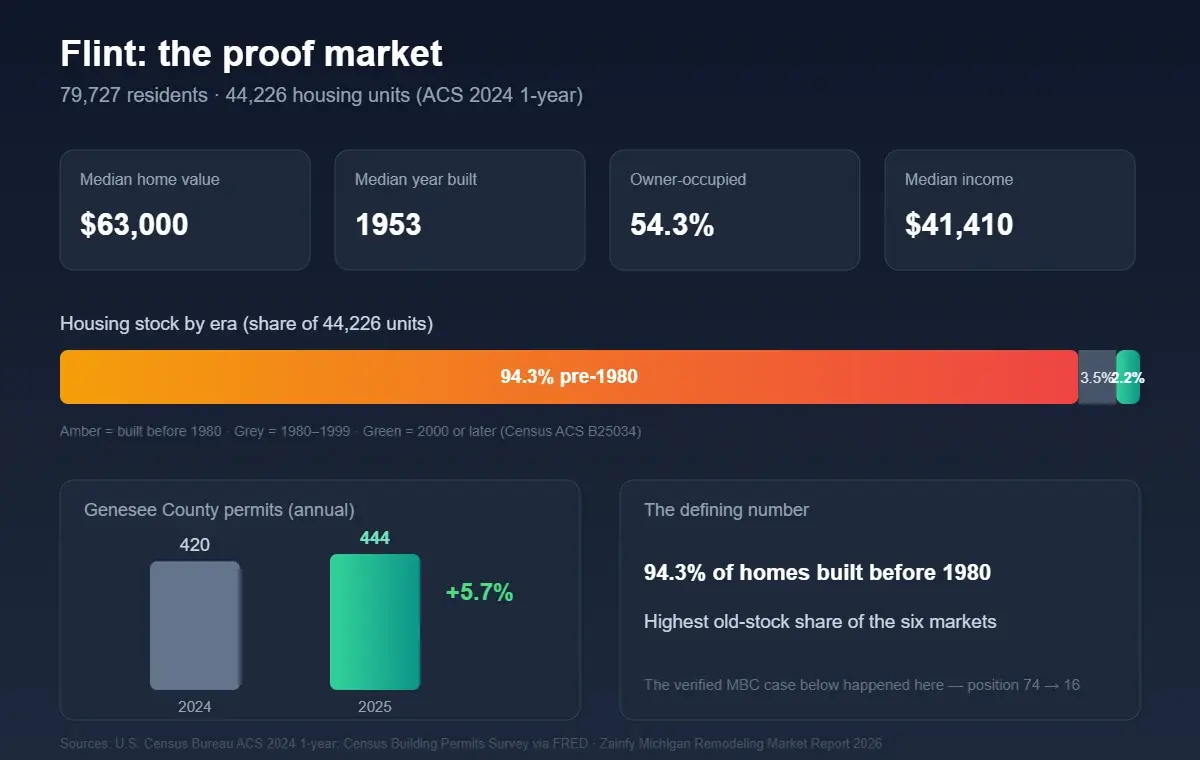
Flint carries the highest old-stock share in this entire report: 94.3% of its 44,226 housing units were built before 1980, with a median build year of 1953 (ACS 2024 1-year). At a $63,000 median home value on $41,410 median income, this is a needs-driven market — repair, replacement and modernization work across housing that cannot defer maintenance — and 54.3% of it is owner-held.
Genesee County’s build side is essentially flat: 420 permits in 2024, 444 in 2025 (+5.7%; Census BPS via FRED). Effectively nothing new is being added to the housing base, so every dollar of housing investment in Flint flows through renovation and repair. For working contractors, this is one of the purest remodel markets in the Midwest.
Flint is also the market where this report’s Michigan case study happened. MBC Building & Remodeling, a Flint kitchen remodeler, went from average position 74 to 16 in four months — full numbers in the case section below. The point for this section: even in Michigan’s most affordability-constrained major market, search demand was deep enough to multiply a contractor’s inbound leads.
The lesson generalizes: in markets where every home needs work, the contractor homeowners can actually find gets the call. Flint’s demand does not need creating — only capturing.
Kalamazoo: the fastest-growing build market
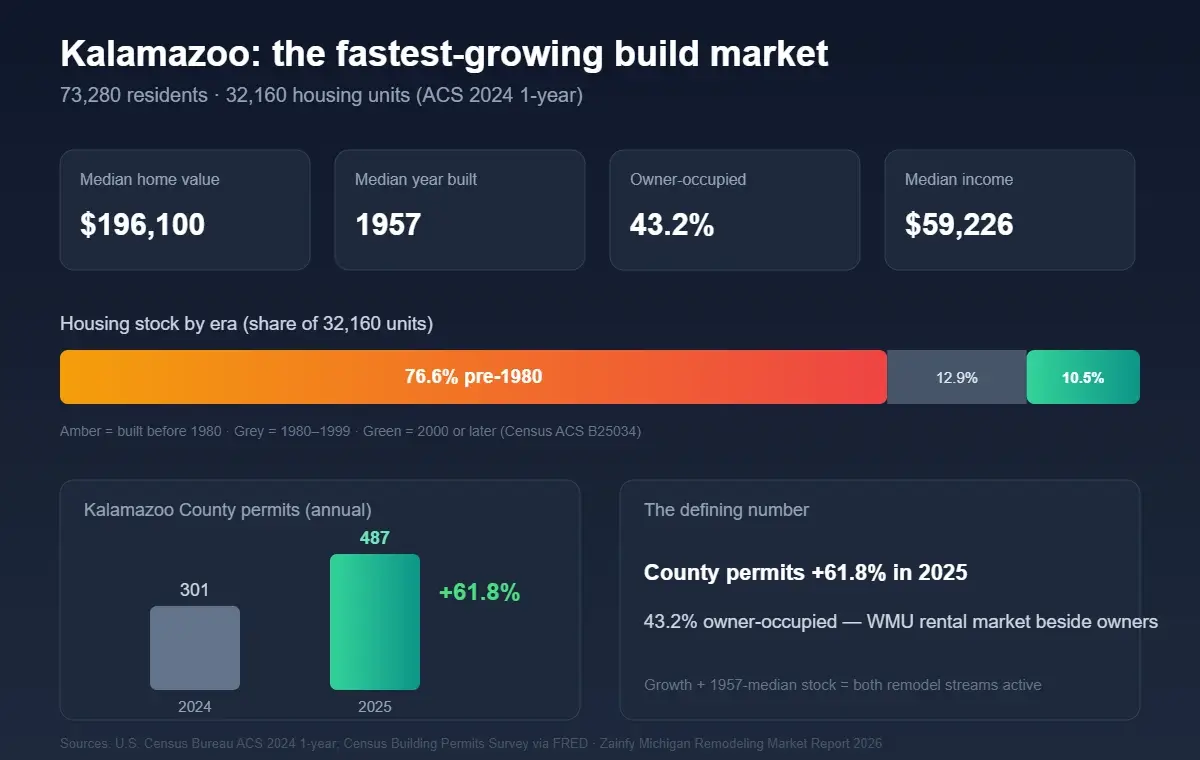
Kalamazoo is the smallest market in this report — 73,280 residents, 32,160 units — but it posted the fastest permit growth of the six: Kalamazoo County permits rose from 301 in 2024 to 487 in 2025, up 61.8% (Census BPS via FRED). Housing investment is accelerating here from both directions, new and old.
The standing stock mirrors the state pattern: median build 1957, 76.6% pre-1980. A $196,100 median value on $59,226 median income puts renovation within reach of the owner base — and at 43.2% owner-occupancy, the most renter-heavy of the six markets, Western Michigan University sustains a rental-renovation stream beside it.
That tenure split is the strategic fact: fewer than half of Kalamazoo’s homes are owner-occupied, so landlord and investor renovation — lease turns, unit updates, conversions — is not a side market but roughly half the market. Contractors who serve both audiences fish the whole pond.
Like the rest of the state, everything compresses into the March–June window. In a small metro, a handful of well-built city and service pages can own the local search results for years — the cost of visibility is lowest exactly where the growth is now fastest.
What Michigan contractors are searching for (first-party data)
From Zainfy’s Search Console footprint across Michigan-market pages (July 2026, shares of geo-tagged demand): Michigan carries roughly 16% of the three-state contractor-marketing demand we measure — the smallest share of the three states, which cuts both ways. Less demand volume, but also far less competition for it: Michigan’s contractor-marketing searches resolve against thinner, more generic results than Georgia’s or Florida’s, and the seasonal rhythm means the contractors who invest in visibility during winter enter spring with the field to themselves.
What Michigan homeowners search for
One number captures how open Michigan’s homeowner-search market still is: “kitchen remodel detroit” draws 150 searches a month at a $5.00 CPC — and carries a keyword difficulty of just 1, meaning roughly 2 referring domains are enough to compete for the top 10 (Ahrefs, US database, July 2026). In a metro area of over four million people, the search a homeowner types when choosing a kitchen remodeler is effectively uncontested. That openness holds across most of the state: Grand Rapids sits at keyword difficulty 22 for its kitchen term and 9 for its bathroom term, and bathroom searches are the softest lane in Michigan — “bathroom remodel ann arbor” carries a KD of just 4. The exception is Ann Arbor’s kitchen term, at KD 32 — level with Tampa’s equivalents (KD 23–33) in our Florida report and the hardest of the Michigan terms we measured. Read the state as two lanes rather than one: Michigan’s demand is smaller than Florida’s, and outside Ann Arbor’s kitchen term the door is genuinely wide open. The AI answers are thinner still — that is what the Michigan runs in our AI visibility test found.
City-tagged volumes across Michigan’s largest metros (Source: Ahrefs, US database, July 2026):
| Keyword | Searches/month (Ahrefs) | Keyword Difficulty | CPC |
|---|---|---|---|
| kitchen remodel detroit | 150 | 1 | $5.00 |
| kitchen remodel grand rapids | 150 | 22 | $3.50 |
| bathroom remodel grand rapids | 150 | 9 | $12.00 |
| bathroom remodel ann arbor | 100 | 4 | $9.00 |
| kitchen remodel ann arbor | 80 | 32 | $4.50 |
What happens when a Michigan contractor closes the visibility gap
One verified Michigan engagement, figures from the client’s own Search Console account, screenshots in the linked case study — MBC Building & Remodeling, a Flint kitchen remodeler:
- Average position 74 → 16 in 4 months, with 81 keywords in the top 3
- Organic clicks 56 → 2,330/month (+4,060%)
- Impressions 7.67K → 138K (+1,698%)
- Domain rating 5 → 17, with 578 backlinks from 163 referring domains
The setting matters as much as the numbers: this happened in Flint — the most affordability-constrained major market in the state. The demand documented across this report converts even where budgets are tightest, when a contractor’s pages answer the specific search a Michigan homeowner types.
What this means for a Michigan remodeler
Three moves follow from the data. First, respect the clock: the 82% January-to-June permit ramp is the season announcing itself months ahead — winter visibility work — December to February — captures the March-to-June commitment window, and rankings move in months, not weeks. Second, sell to the stock age — in a state where the median big-city home predates 1972, the winning message is competence with old houses: systems, structure and surprises, not just surfaces. Third, pick your economics deliberately: Ann Arbor and Grand Rapids reward premium positioning, Lansing and Kalamazoo reward volume and dual owner-renter coverage, and Detroit and Flint reward being findable at scale in markets where necessary work never stops. Georgia poses the same tier question at a higher altitude — a single state holding both a $789,000 and a $136,600 median-value market — and the tier a contractor chooses shapes everything downstream of it.
About the data: Michigan permits — U.S. Census Bureau via FRED (MIBPPRIV, monthly; county figures from the Census Building Permits Survey via FRED: Wayne, Kent, Washtenaw, Ingham, Genesee and Kalamazoo counties), retrieved July 2026. Population, housing units, home values, incomes, year built and tenure — U.S. Census Bureau ACS 2024 1-year, via Census Reporter. Search demand shares — first-party Google Search Console data, Zainfy, July 2026. Client figures verified in the client-owned account; case study linked. This report pairs with our Remodeling Contractor Search Demand Report 2026. The other reports in this series are listed in the Zainfy Research index.
This page is refreshed annually. Next refresh: July 2027.
Zainfy — SEO, WordPress web design, social media marketing and paid ads management for home remodeling and construction contractors in Georgia, Florida and Michigan.